


Most companies consider growth as merely acquiring new users.
That’s not the case. Focusing only on the new acquisitions is like filling water in a bucket with a hole.
Gaining new users only to see them leave in a few days isn’t helping your business. You might ask, “Then what’s going to help it?”
The answer is retention along with the acquisition.
The goal should not be just bringing in new users but making them stay. Retention is critical to sustaining in the market. Moreover, only retention can tell the effectiveness of your product. Higher retention is proof of usefulness.
With such high significance, retention can’t be ignored. Cohort analysis can help you focus on it. Let’s dive in to know more about cohort analysis and how it is advantageous in many other ways.
What is cohort analysis?
What’s an easier way to understand users deeply?
Divide and rule analyze.
Say you consider users as one whole unit. In that case, the chances are that some crucial user insights will go unnoticed. You might also miss a few prime nuances.
But when you categorize users based on their common traits, the analysis gets more profound and better. That is what cohort analysis is about.
The word ‘cohort’ means a group of people with a shared characteristic.
Cohort analysis is the process of segmenting users based on their similarities. You can observe how the different user groups approach your product. You can mainly track how they engage with your product.
Types of cohort analysis
Cohorts, as we now know, are groups of people. But what’s the common characteristic that the members of a group share?
Well, in cohort analysis, you do the grouping or segmentation with these two criteria,
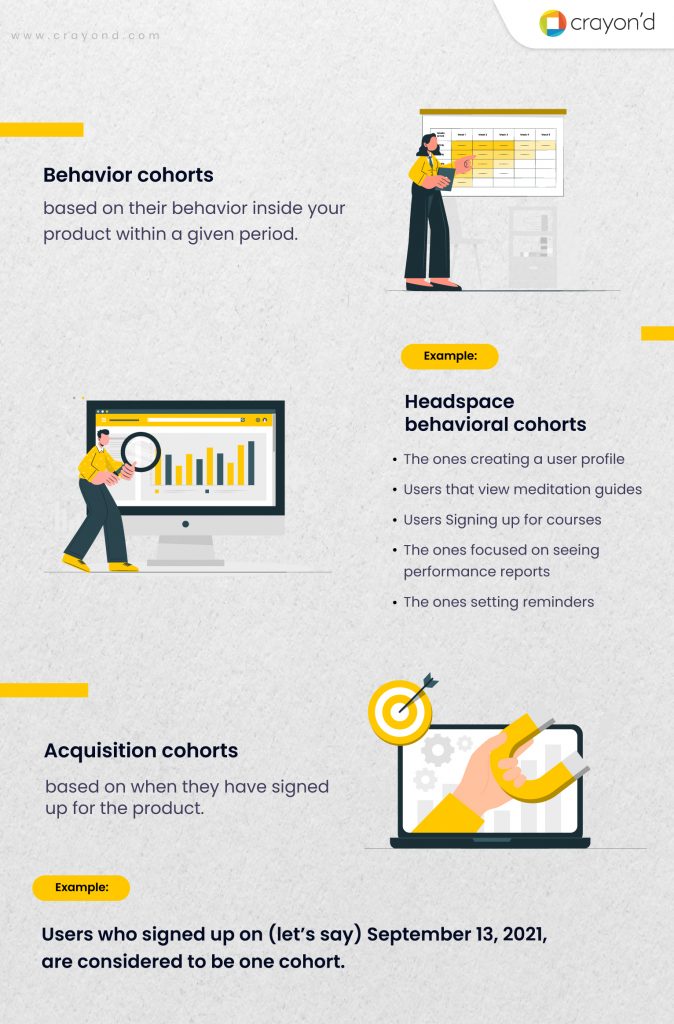
1. Behavioral cohorts
Behavioral cohorts groups users based on their behavior inside your product within a given period. Here, behaviors are usually any number of discrete actions taken or avoided in the set timeframe.
For example, take a meditation app like Headspace. The various behavioral cohorts that you would observe are:
- The ones creating a user profile
- Users that view meditation guides
- Users Signing up for courses
- The ones focused on seeing performance reports
- The ones setting reminders
If that’s a bit complicated for you, let’s take the example of LinkedIn. Behavioral cohorts would fall under these categories:
- Completing user profile
- Adding connections
- Engaging with other profiles
- Posting content
You can track these actions separately or as combinations. You must decide a period (for example, a week after signup) before tracking.
2. Acquisition cohorts
Acquisition cohorts divides users based on when they have signed up for the product. These cohorts are categorized based on where they are in their user journey.
You can track based on daily, weekly, or monthly cohorts. But what do you measure using acquisition cohorts? You see how long they stay as a user since their signup. Hence, you will know the retention rates, in turn, the lifetime value (LTV) metric of the cohorts.
In the acquisition cohort, you can group users based on the day they sign up. For example, users who signed up on (let’s say) September 13, 2021, are considered to be one cohort.
In the behavior cohort, you group based on the user who did the same action on the same day. For example, the user who set reminders on May 30, 2020, comes under the same cohort.
How to do cohort analysis?
You can do cohort analysis easily if you have a product analytics tool. Some of the tools you can use are Google Analytics, Amplitude, Mixpanel. Use a tool of your choice and preference.
1. Using acquisition cohorts — Know when the users drop out
Analyzing acquisition cohorts help you discover when the users are dropping off. Let’s look at the cohort chart here:
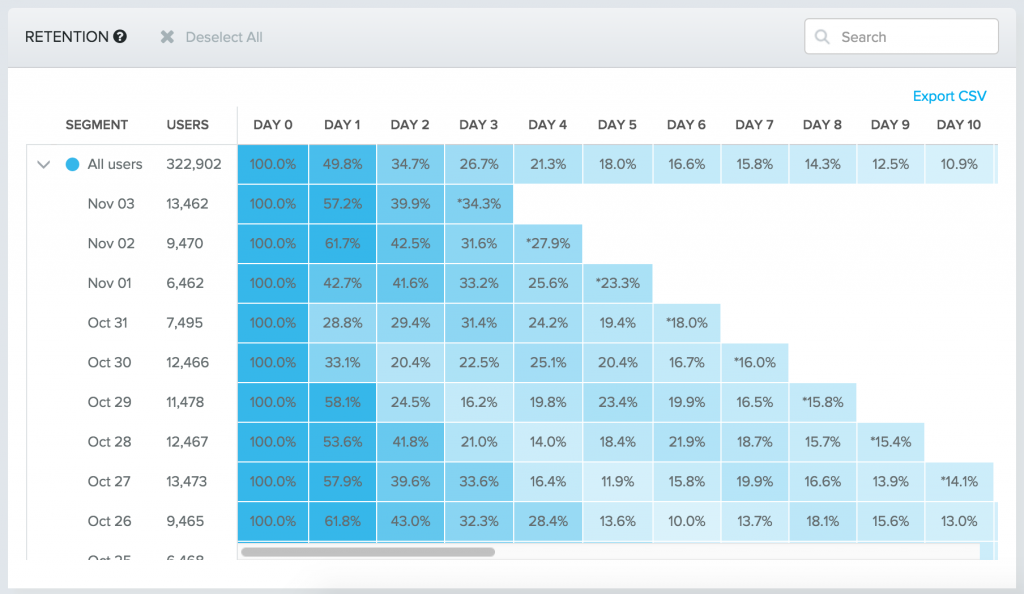
Here, the segment refers to the cohort. The users are divided into cohort groups based on the acquisition date. Users who signed up on Nov 03 (i.e., 13,642 users) belong to one cohort group. Similarly, there are cohorts for every day.
Day 1, day 2, day 3… are the days after acquisition. The percentages below each day are the retention rate. So, for example, if we take Oct 30, there are 12,466 users. Out of them, 33.1% are retained on day 1, 20.4% on day 2, and 16% on day 7. Every cohort has its own retention rates. And there is an overall retention rate (for all users) at the top.
You can also visualize it in the form of a curve like this:
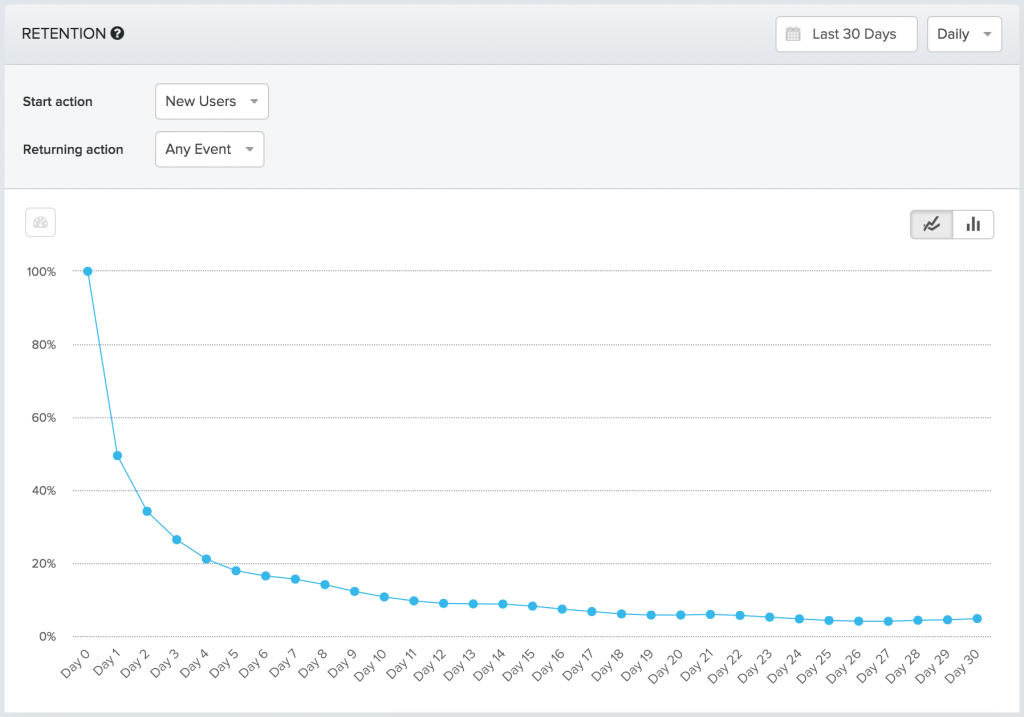
With this curve, it’s easy for you to see when most users drop off. In this case, it’s immediately after day 1.
The huge advantage of the acquisition cohort— you can discover the exact spot in the user journey that leads to the churn. And then figure out the problem, thereby going on to rectify it.
2. Using behavioral cohorts — Find churn causing behavior
Every user performs a number of actions inside the product right after signing up. The decisions they take in their user journey result in these actions. The results that follow those actions are the cause of their continued stay or churn. Analyzing these can shed light on issues related to the particular task flow.
Behavioral cohort analysis clubs the users performing a particular action into a cohort group. And then track the retention of those cohorts. For example, consider a music app in which user actions can be
- Having more than 3 songs added to favorites
- Having less than 3 songs added to favorites.
Here’s the retention curve for the cohorts.
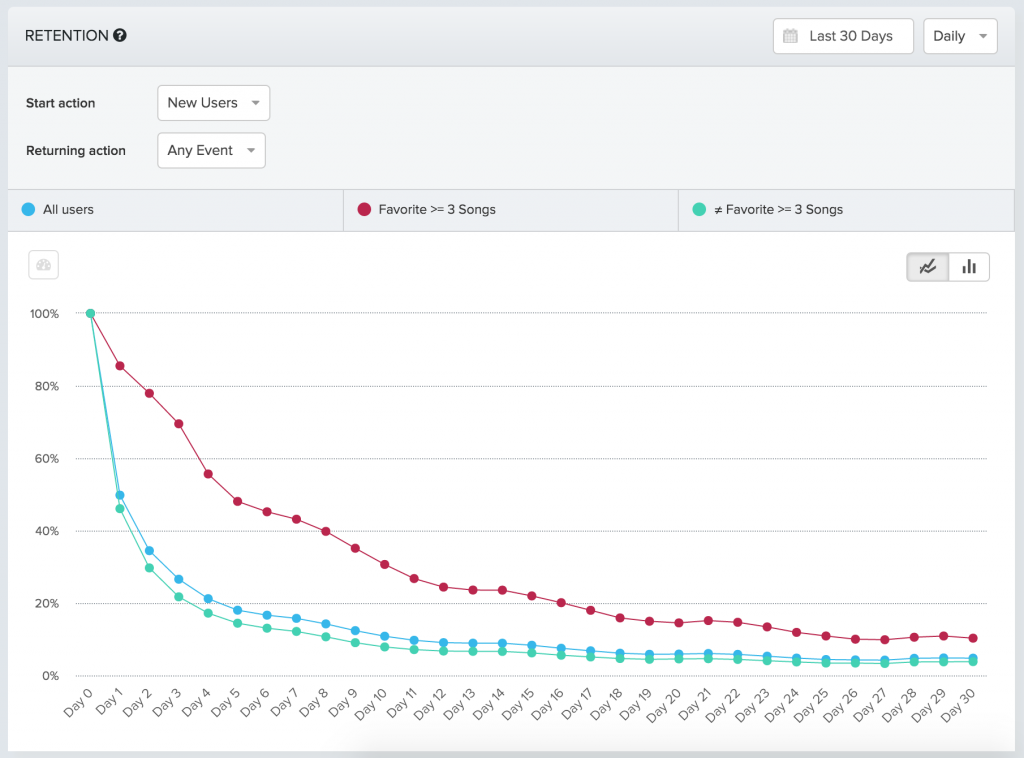
From the curve, it’s obvious that the second category has worse retention rates. In behavioral cohorts, you can view retention rates for a number of actions together.
You can also combine the insights of behavioral and acquisition cohorts to arrive at a strategy.
Every hypothesis you arrive at might not work. In the above case, the favorite song might not actually be the criteria that make them stay. You have to do testing to confirm its effectiveness.
3. The actual process
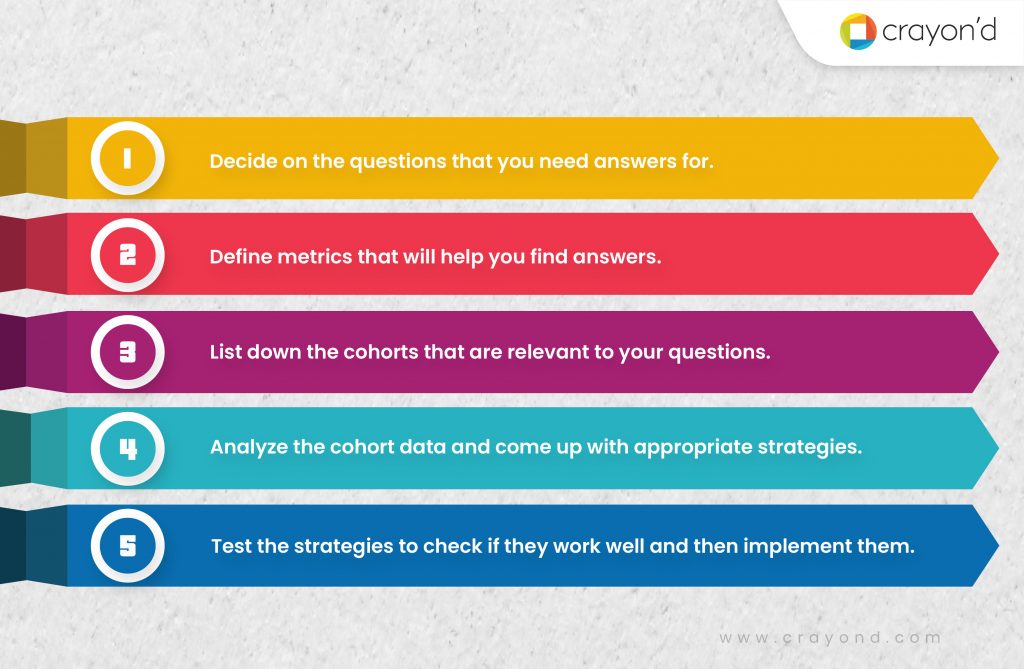
While you have seen the two techniques, a random analysis will not help. You need to have a systemic approach to cohort analysis to get better results. Here’s how you can proceed with it,
Why use cohort analysis?
The benefits of cohort analysis aren’t just restricted to one industry or department. It’s helpful across different verticals like e-Commerce, SaaS, digital marketing, and much more.
As for the departments, it helps the entire product team and marketing team. From the product aspect, cohort analysis helps find the areas of friction. This way, you can keep improving your product and its features. Constant improvements make your product better and better, don’t they?
From the marketing perspective, cohorts help with understanding campaign performances. And so, you can tailor the apt campaigns and product messaging that leads to a good number of conversions.
That’s not all. Cohort analysis also helps,
Improve LTV
Customer Lifetime Value (LTV) is an important metric. A longer LTV adds value to the business. Cohort analysis can help you look at LTVs of different user cohorts. You can see which cohorts have high lifetime value and then track the features and reasons connected to them.
You will know which acquisition strategies & channels, retention techniques, and marketing campaigns are effective. Moving forward, you will know which strategies to implement to improve the LTV of the entire user base. You can also generate plans to push people towards retention-improving features.
Improve profitability
Cohort analysis enables you to know better about the user groups. Like, which cohorts are likely to upgrade plans or cross-sell. And then, you can prompt them with appropriate upselling messages.
You will also know which groups yield more revenue, how discounts affect profits, and how to optimize these.
Secure from vanity metrics
Vanity metrics are the ones that look good but don’t have any meaningful business results. Often, these metrics drive companies to make misleading decisions.
Cohort analysis helps you get deeper insights on prime concerns like retention and revenue. It will show you the reality. And so, you will work on improvements rather than fake contentment.
How does cohort analysis help improve retention?
The first step in improving something is giving it attention. Then you have to shift from attention to evaluation. Cohort analysis does it all. It helps you get aware of retention, brings your focus to it, and then lets you analyze it.
To be more specific, cohort analysis helps you measure your current retention rate. When you do so, you will know if an issue exists or not.
Most products suffer from early churn. Optimizing the retention rate here will reflect on the overall retention of users. Cohort retention analysis aids in unearthing when exactly the churn happens through the acquisition cohort. And then, you can use behavior cohorts to know
- Which action/actions lead to churn?
- Which user flow has the problem?
- Which part of the user journey (acquisition cohort can also reveal) does the issue occur?
You can then think of ways to reduce the friction with the action and improve the flow. Well, cohorts also identify which user actions don’t cause churn. So, you can either redesign such that the particular user action comes first in the onboarding flow. Or you can tweak the problematic action and improve it.
You can also ideate strategies to increase adoption and activation from the cohort insights. When the flow is optimized to improve both, you can increase retention rates.
But as mentioned earlier, you need to test your hypothesis before putting them into action.
Cohort analysis example
In 2019, Passion Factory launched BalanceFriends.
BalanceFriends helps Korean women to get into a fitness and health routine. It is a chatbot-based app that guides and coaches users about diet and exercise. All of this happens through conversations with the bot.
The team wanted to test the effectiveness of chatbots for different users. They also wanted to know the user segment with high retention and the reason behind it. The BalanceFriends team conducted cohort analysis using the Mixpanel tool.
They were able to classify users into different cohorts based on their chat preferences. Then they tweaked the user flow based on the individual group’s choice and taste. The team also came up with personalized push notifications for each cohort.
As a result, they could see their user retention consistently growing, with more than 250% increase in the 4-week retention rate over one year.
Endnote
Who determines your product’s success?
The users.
It doesn’t matter if your product is innovative. It doesn’t matter if it solves the biggest problem. If the users aren’t finding it to be good, they aren’t going to stay.
So, it’s important to figure out how users approach and think of your product. The biggest challenge here is understanding how different one cohort is from another. That’s where cohort analysis comes to your rescue. You can analyze different user behaviors in-depth and cater to different groups accordingly.
Also, cohort analysis improves retention through constant product improvements. Regular performance analysis and user behavior study can push your product more in the path of product-led growth.
Cohort analysis thus gears your business up for the trends and long-term growth. Haven’t seen your cohort data yet? It is time to do it!


Add comment