


“People ignore designs that ignore people”- Frank Chimero.
User-centricity is the core of successful products. To be user-centric, you need to know what users like, expect, and want. While user feedback and interviews can help, a few more sources of data add more efficacy and accuracy. Like the ones that derive insights from the users’ interactions.
On various occasions, what the users say they want might contradict what they actually want. This is why you shouldn’t rely on user inputs alone. User-product interaction data comes to your rescue here.
While intuition can help you develop designs, data can help you mold and shape them better. Design dictates the majority of the product experience. And, data-driven design is essential in this era of product-led growth.
Let us dive in to know more about data-driven design practices. It is time for you to grab some notes!
What is data-driven design?
Data-driven designs are the designs improved based on what the data suggests.
Data aids the team in evaluating the design performance. It shows how the users receive and handle the design. Data helps to envision how effective each part of the design is in terms of looks and functionality.
The design team needs to remain user-centric. However, it is easy for the team to get carried away with personal biases and opinions. Once the team starts the design process, the possibility of the team’s view mixing up with user inputs is pretty high.
Designs that you don’t constantly monitor and tweak will not be profitable. And it will be hard to sustain in the competitive market. Well, it is also impossible to design perfectly in one go. Data is how you can make it better and take it close to perfection.
For example, Headspace found out that there was a 38% drop-off rate before onboarding completion.
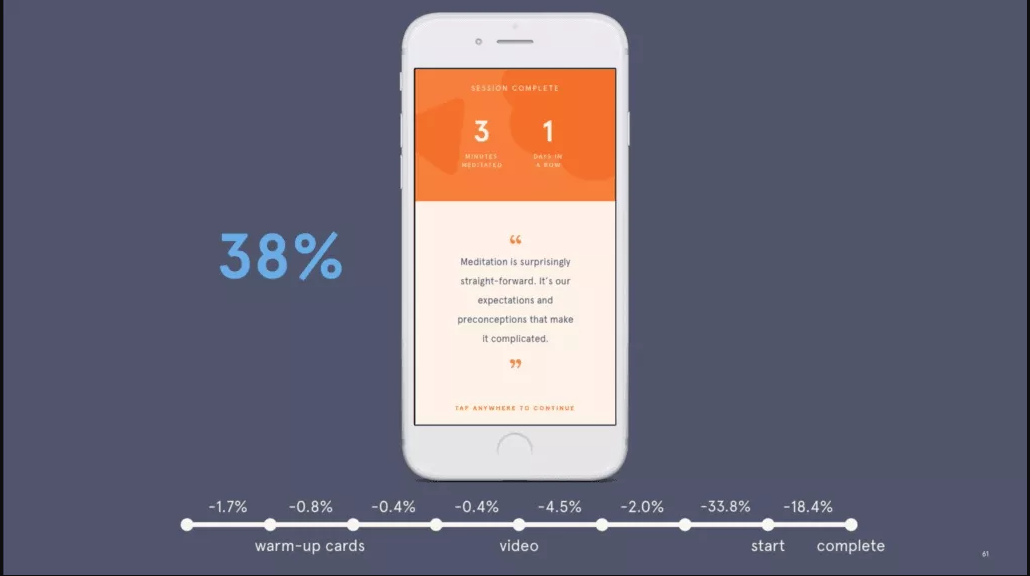
So, they came up with 3 data-driven hypotheses,
- Exit-able onboarding steps
- User-preferred onboarding flow
- Instructional gif instead of video
This resulted in both the session time and home screen views going up.
Well, data isn’t something that will curb intuitiveness in design. It will help you validate it so that no risks are attached. Data also empowers designers to propose big changes to designs by backing them up with proof.
Why does data-driven design matter?
Designers ≠ Users
Designers can try to fit inside users’ shoes. However, they aren’t users. It’s natural for them to get deviated from the user’s needs. They cannot think simultaneously from a designer’s perspective and the users’. No matter how much they try, they might miss out on little details.
In such circumstances, such personalized data can be very helpful. They reveal even the littlest nuances to the design team.
Maximize ROI
While ROI is dependent on the culmination of many factors, data can do its part here. For instance, Virgin America decided to make changes to the digital experience of travelers. They developed a new design and conducted A/B testing with the old one. Finally, they released a responsive website and, as a result, they had a 14% increase in conversion rate.

Don’t just rely on best practices
Everything changes with time, even facts and truths. Times are such that technological advancements are occurring rapidly. And design trends change in the blink of an eye. And, the product designs must be able to cope with it.
In that case, it’s not good if your team is just dependent on the best practices. The data-driven design process helps you move beyond guidelines and best practices. You can make timely decisions based on present user actions.
Types of data to be collected
If the data-driven design is a cake, data is the batter. You need to collect the best flour to make the batter. This will behest how the cake will turn out to be. Here are the two kinds of data you will require,
Qualitative data
All about feelings.
Qualitative data is concerned about how the users feel. It will answer the question ‘why’. Unveiling users’ emotions behind their actions are the basis of qualitative data. To acquire this data, you can make use of one or all of the ways below.
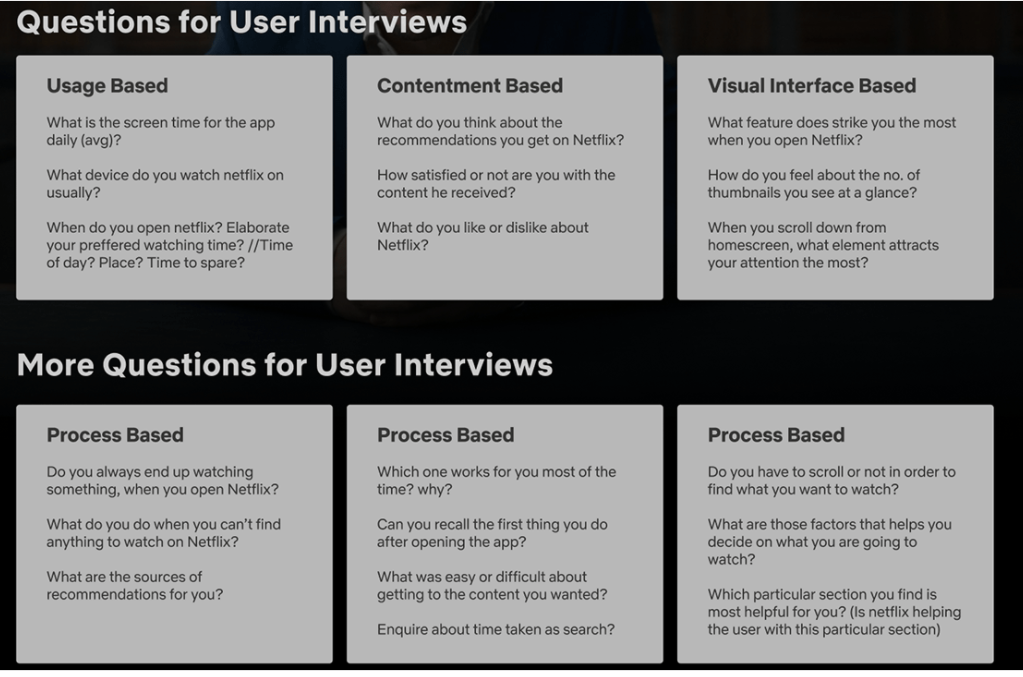
Interviews
Asking the users questions about the designs- its ease of use, complexities, and user’s suggestions can reveal a lot.
User interview for Netflix tweaking.
User testing isn’t about the product’s performance. It’s rather about how the users handle the product. However, it can also reveal some surface-level quantitative data.
User flow
User flows visualize how users move inside your various design screens. Right from where they land to where they leave, their trails show the nature of their interactions. User flows can clearly indicate issues when users aren’t following the predicted path.

Quantitative data
All about numbers.
Quantitative data can answer- who, what, when, and where. Mostly it will reveal, ‘how your product performs’ through numerical data. For example Bounce rates, visitor metrics, time on site, etc. You can collect this data in the following ways.
A/B Testing and Multivariate testing
A/B testing is used for finding the most preferred among the two versions of a product screen. The version variation is usually a single element. You test each version by breaking down your users into 2 groups and showing each version to each group.
A/B testing of a security management app.
In multivariate testing, you test to spot the best among more than 2 versions. The version variations are the combination of one or more element differences. You can make use of conversion rates to know the design that your users opted for.

Product analytics
Product analytics is a goldmine of data when it comes to product performance. Who are the users, how long do they stay, when does the conversion take place and more such data can be obtained using this. You can even see the behavioral patterns using heatmaps.
Heatmap of a user–therapist connecting app.

Surveys
Surveys can be effective but you have to frame the right questions and apt options for the users to choose from. It can contribute some qualitative data as well but it’s all question-dependent.
Survey for online fresh juice ordering app.

Data collection is a vast process. You have to define the sources right. Sources are to be chosen based on the goal of the process. It will save your time from collecting data unwanted for the objective.
How to analyze and present data?
While designers can propose changes, it’s upon the product owners and stakeholders to make approvals and decisions.
You need to present the data in a way that’s easy to perceive and persuade. Only with extensive data analysis, you will have a proper understanding, which will, in turn, provide you with ideas to present it right.
The route to a successful data-driven process is effective data analysis. If you do it superficially or for the sake of doing it, you aren’t gaining anything. And loss? There’s a ton.
Handling data can be very tricky. During data analysis, you’ll be finding patterns easily. Don’t be quick enough to reach a conclusion. You need to dig deeper to see if the pattern is real or not. Chances are that your data might have anomalies. Be aware enough to detect and process them. A broader data range can help you out of the trap.
Once you get a message out of your data, it’s time to showcase it to the team.
Data can be highly insightful and hard to understand. Visual representation is how you take away the latter quality. You can make use of bar graphs, pie charts, maps, timelines, etc. This will convey the problems, trends, and patterns in a way that’s easy to grasp.
And when such visuals are involved, proposing a solution and convincing the team for approval becomes less complicated. But that isn’t all. You need to add the right reasons in your presentations to make product owners and stakeholders go for it. Visual data is an elevating element.
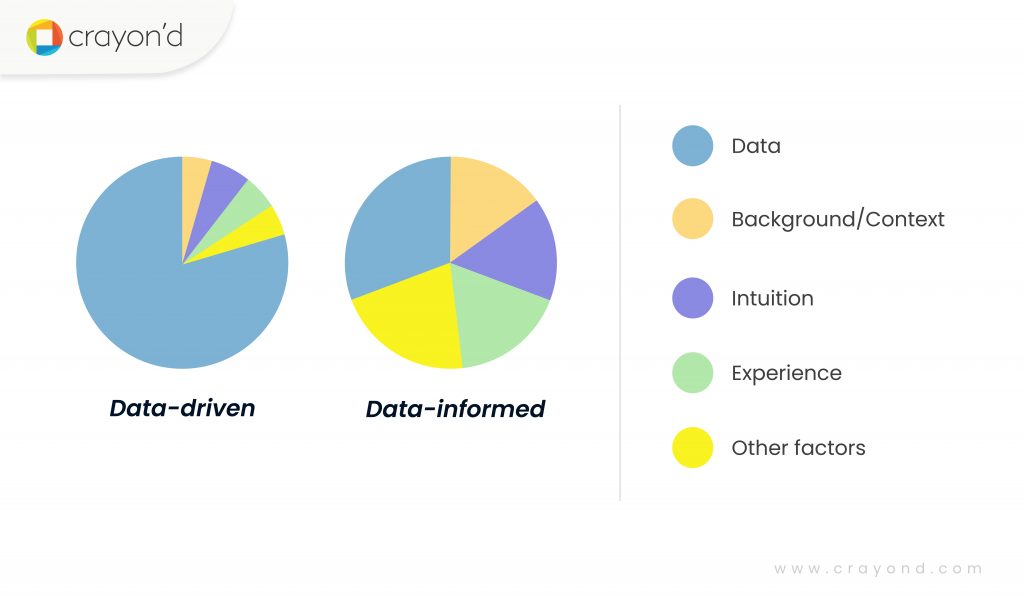
Data-driven vs Data-informed design
While both data-driven and data-informed involve data, the difference is about the intensity or weightage.
With the data-informed design, data is just another element. You’ll have to bring in other factors also. They include your intuition, past experience, and empathy. In the case of data-driven design, data is the core. Decisions are made based on what data represents. The other factors have a meager role here.
Tips for the data-driven design process
- Data is what you interpret
Data is an effective tool. However, it all comes down to how you interpret it. What you look for in the data dictates the rest of the process. Rightly processing and analyzing it is crucial.
Data isn’t something you can believe as it is. It isn’t objective truth. And every insight is subjective to portions of data you cover. You need to validate the patterns. Here is where your reasoning comes to play. Unlike the common saying that data-driven design is killing instincts and thinking, you will be using them in terms of data analysis.
- Combine qualitative and quantitative data
Why use one, when you can derive the power of two?
Both data reveal different insights and when combined, reasons will have numerical proof and numerical insights can be linked to a reason. A mix and match of both can add more meaning to the observations.
- Adhere to the goal
Your process must be tied to a goal. If not, it’s just directionless. Why would you waste your time, resources, and money on a process that isn’t taking you anywhere?
Clearly communicating goals and setting up your process around them is crucial. The goal can be redesigning either a small portion, the complete design, or creating a new design. Data sources will change based on this.
Endnote
Data is what you make it to be.
Using it in a way that supports or helps curb your intuition is all in your hands. When you gather data, you should ensure that it covers varying human experiences and their complexities.
Data isn’t the deciding factor as it seems to be. The team’s perception is. Make use of data for discoveries and enlightenment and not for proving points. Data should be used for initiating improvements. It should empower the design team with a better understanding.
Having said it all, design is an iterative process. You learn through designing as much as from data. There is always room for improvement.
Designs need constant tweaks. Designs need to accommodate the changing human behavior and expectations. They need to compete in a marketplace filled with innovations.
And, when data is offering you a helping hand, why not grab it?


Add comment