


The way a product owner perceives the product differs from the way it is perceived by the users and customers. It is essential for you to know how your product is performing in the marketplace competing with other products.
Continuous monitoring of the product’s performance in the market will provide you with a lot of insights. A product can be positioned among the users in a better way only when you understand how it is received in the first place.
It also helps you to know if it can satisfy the market and is suitable to be classified as a Product-Market Fit.
Metrics and their resulting data are the way to do this. Product management has become data-driven these days. But how to choose the right metrics and make the best use of the data? We have the answers inside. Let’s go down the lane to know them.
What are product metrics?
Product metrics are data that hold the measurements and details about a product’s success and its performance efficiency both in technical and marketing means.
These metrics help in analyzing the product through various viewpoints and aspects. These viewpoints help in suggesting improvements relating to your product.
Why are product metrics important for your business?
“You cannot manage what you cannot measure.” This old saying is more apt and applicable when it comes to product companies.
Product metrics keep you well-informed about your business. Data-driven knowledge helps you in making good decisions regarding your products.
Measuring the performance will also let you know the status of your product in the market. Analyzing and understanding product metrics always sets a path of betterment for your product.
Metrics are not just for measuring product performance, but also for strategies that you have used.
After all, it is much better to measure and improve than sit with mere expectations.
Top 7 product metrics that matter
Now that you have understood the importance of metrics, you are ready to measure them. But you can’t use the metrics just because other companies in the market are using them.
This is because every product is unique. And every business is unique. The first step in deciding the right metrics for you will be understanding your business goals.
The next step is knowing your product. What matters and what doesn’t solely depends on the nature of your product. Once you have understood it, you would have a clear list of expectations for your business and product performance.
As soon as you set these expectations, you start looking for metrics that would suit them. But there are a variety of metrics each company measures.
The sheer amount of possibilities can make you lose track of what is important.
That is why we have compiled the top 7 product metrics you can choose from.
Let’s begin.
1. Acquisition metrics
You cannot run your business without customers. All other things like engagement and satisfaction come only after acquiring/having the customers onboard.
Any business can be rightly tagged as ‘growing’ only when it starts acquiring new customers. Acquisition, being an important part for a product to set its foot in the market, should be monitored constantly.
Keeping a track of the acquisition metrics can give a lot of valuable insights for your initial marketing strategies. A lot of metrics can help in measuring the effectiveness of your acquisition efforts and methods.
Let us go ahead and explore 3 important acquisition metrics that you can use for your product.
a. Customer Acquisition Cost (CAC)
Customer Acquisition Cost is the cost of marketing and sales operations you perform for acquiring new customers for your product.
There are many categories in sales and marketing, where you spend on getting new customers. You will be spending on salaries of marketing and sales employees, advertisements & campaigns, content creation, etc.
For calculations, you have to decide the period for which you would like to measure the CAC. Once you determine the time, you collect the details of the cost and new customers acquired.
Formula
Customer Acquisition Cost =
Cost for Marketing + Cost for Sales/ No. of new customers
For example, your company spends $30,000 on marketing, $20,000 on sales, and you have got 50 new customers.
Your CAC will be obtained by adding $30,000 and $20,000 and dividing this by 500, which is $1000.
Insights and importance
CAC is an important metric as it helps in knowing your ROI in marketing and sales.
CAC doesn’t have any benchmark values. In general, a lower CAC is always better. But there is no such value of CAC that can be called good or less. To decide if your CAC is good, you have got to use it along with another metric, the Customer Lifetime Value (CLV).
The ratio of CAC and CLV should be 3:1. That means the customer’s lifetime value must be 3 times the cost of acquiring them. Any value less than this is bad.
To reduce your CAC
- Focus on the right audience. This can be made possible when you have a clear understanding of the user persona.
- Automate certain processes of marketing like sending emails.
- Optimize your marketing funnel (customer journey representation)
During the beginning stages of your business, the CAC may be higher. As your company grows with more customers, you will eventually figure out an apt acquisition strategy, and the CAC will decrease.
b. Cost Per Acquisition (CPA)
This metric is used to calculate the cost you spend on the acquisition of something that is not a customer. This may be the acquisition of a lead or signup for a free trial for your product. CPA is related to CAC because it is the gateway or pre-processes in acquiring a customer.
To understand the difference better, if a user signs up for Netflix free trial, this action is taken into account for measuring CPA. But if a user starts paying for a Netflix subscription, then the action is taken into CAC’s account.
Formula
CPA= Total cost of campaigns/ No. of acquisitions
Acquisitions are made possible through marketing campaigns. You can calculate the CPA for each channel through which each campaign is held.
Insights and importance
Only if your CPA value is high, the possibility of acquiring paid customers will also be high. CPA is used to measure the effectiveness of your marketing strategies and campaigns across various platforms.
Calculating CPA for individual channels and comparing it with the others can help you find the right channel for your product acquisitions.
To reduce your Cost Per Acquisition you can
- Cut off the costs for channels where the acquisition isn’t good
- Optimize your landing page
- Optimize the marketing strategies
c. Conversion Rate To Customer
The Conversion Rate is the measure of the potential customers of your product who are website visitors performing any desired action.
The desired action is something that aims at the conversion of potential customers into paid customers. For example: making a purchase, signing up for a product, and upgrading from a free trial to a paid subscription.
Formula
Conversion Rate To Customer = No. of website visitors who performed desired actions/ Total no. of visitors
Insights and importance
Tracking Conversion Rate helps to know if your landing page and on-page experience are effective. You can measure the success rate and also identify the areas that need improvement.
You should focus on increasing your conversion rate. The conversion rate is a direct contributor to the revenue.
Conversion Rate can be improved through a process called Conversion Rate Optimization (CRO). This process helps in identifying the reasons for less conversion and coming up with new ideas. These ideas are then tested and implemented.
2. Engagement metrics
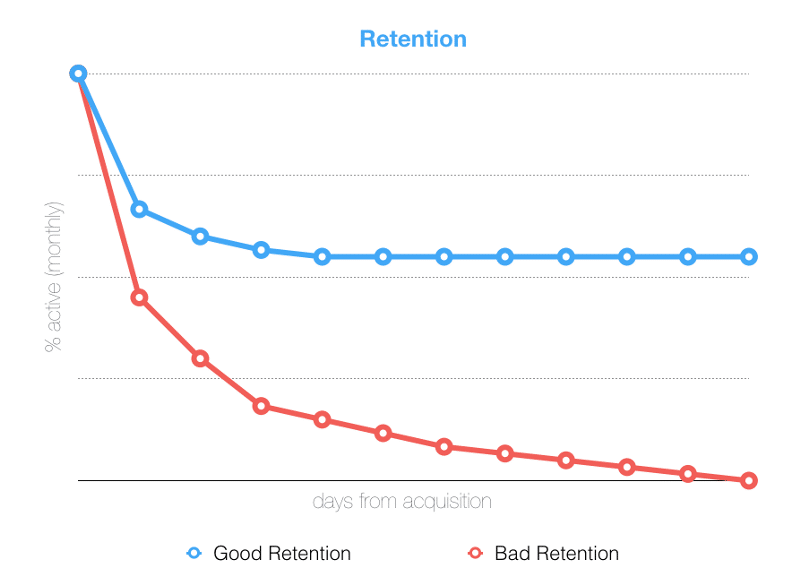
Engagement is at the core of any product’s success. A product sustains only when people are engaging with it. Products with a high number of active or engaged users have high retention rates. The following graph depicts the difference in retention.
Engagement is the indication that your product provides value to the users.
Acquiring new customers is of no use if the customers don’t find value in your product. Poor user engagement helps you understand that your product has some problem that needs addressing.
But there is yet another greater use.
Measuring and trying to improve these metrics can bring a lot to your business.
A user who engages a lot with your product will most probably become your advocate. They may bring new customers to your product. Now that you have understood the importance of the engagement metrics, we will see two important engagement metrics for your product.
a. Product Engagement Score (PES)
This metric is a measure of the level of engagement our product has with its users.
For this, you have to define what ‘engagement’ means to your product. You must make sure that ‘engagement’ must denote the usage of any particular product feature.
Formula
Product Engagement Score = (w1*n1) + (w2 * n2) + … + (w# * n#)
Where ‘w’ is the action you have assigned for engagement, and ‘n’ is the number of times the action is done by the users.
Sometimes your product is used by an organization, so there might be multiple users engaging with your product. To avoid confusion, you can categorize the measurements as
- For individual users
- For an organization
Insights and importance
PES is very helpful in understanding if your customers are happy with your product features.
A less engagement score, for either the overall product or for any individual feature, is bad. This indicates that the users are finding difficulties in your features or not finding them useful. Gaining this data, you can start to work on improving that particular feature or your product itself.
b. Feature Usage
While product engagement score measures the engagement with the overall product, feature usage measures it for a selected feature. This metric is of great use when you are launching a special feature. Measuring this value gives an answer or clarity to the question,
“Does the feature add to the usefulness of the product?”
Formula
To have clear insights from the metric, you must have a sorted-out calculation. Only having 360-degree analysis can give valuable and actionable data. For measuring feature usage, there are multiple ways possible. They include:
- Total number of users per day
- Average uses per day
- Total number of unique users for a given time
- The ratio of feature users to the product users
Insights and importance
The feature adoption metric calculation itself follows diverse ways. Hence it answers many questions like
- What category of product users is getting benefited from the feature?
- How is the feature used?
- How is the feature performing overall among the users?
With these answers, you can conclude whether or not the feature is helpful. You can also improve the features with the help of these metrics and data.
c. Active Users
It is the measure of unique customers interacting with your product, at any given period.
This metric can take multiple forms such as:
- Daily Active Users
- Weekly Active Users
- Monthly Active Users
Let us take the example of Monthly Active Users and see the calculations.
Formula
There is no specific formula for the calculation of active users. Also, the term active is not supposed to be taken at face value because the ‘activity’ depends on the nature of the product.
To measure the number of active users for a month, you have to decide what the term ‘active’ means for your product. It may be logging in, opening the app, or pressing a certain button.
Once the criteria for ‘active’ is set, measure how many unique users are meeting the criteria, for 30 days. This will give you the value of Monthly Active Users.
Insights and importance
A low number of active users indicates that your product is not clear or compelling enough to use. You must re-evaluate the onboarding process.
This metric helps in understanding the ease of usability of your product.
3. Health metrics
Products are made to solve user problems or provide a solution that is better than the present ones. For these advancements in functional expectations, your product must be technically efficient.
For example, you are using apps like Google Pay because it helps you in faster and easier transactions. Consider a situation where you are in the middle of an urgent transaction and the app doesn’t respond. This makes the app lose its reliability.
When it loses its reliability, the customers will not hesitate to jump to other competitors’ products, which might perform better.
Health metrics can help you assess the technical performance of your product. Here are 2 metrics that you can take into account for your product.
a. Load Time
This metric measures the time taken by the pages in the product to load in its entirety. There are various visual and functional elements in your product/app like images, navigation bars, CSS, and HTML elements.
Reduction in load-time has impacts on your business much more than you think it will. The following data from Think from Google has reported how fast people exit your web pages if they had to wait for your pages to load.
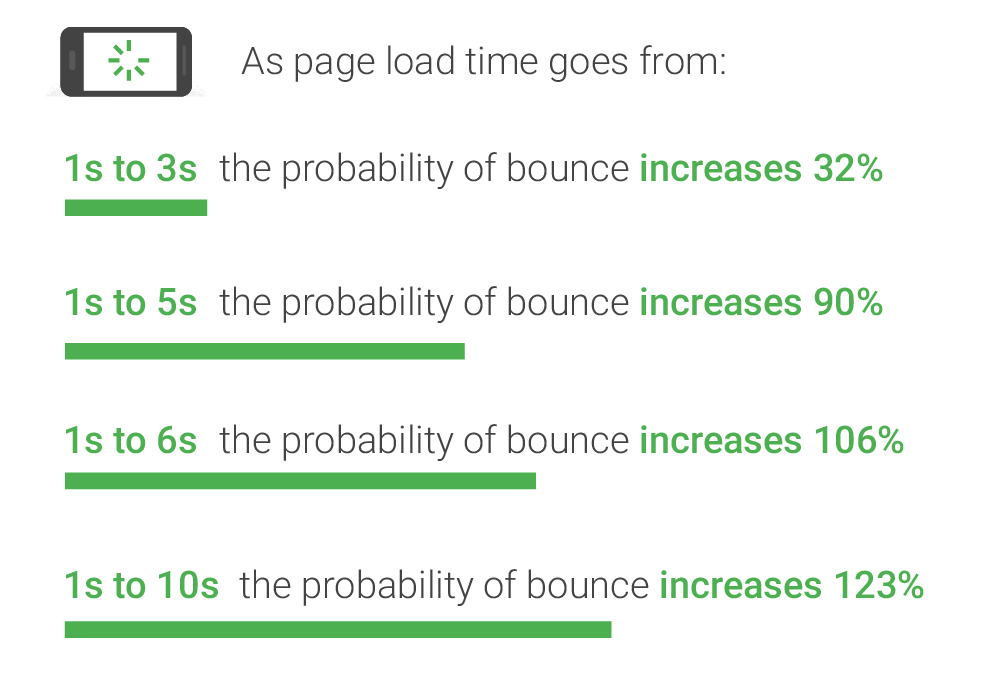
People, when they experience slow load time, are more likely to abandon your product.

Insights and importance
You may update your products at regular intervals. Also, new features may be added. You must ensure that the code that enables the new feature should not act as a barrier to the quick loading of the pages in the product.
A new feature addition should only make the performance better. Load time is the measure of your product’s performance. Hence, the updates should not affect the performance negatively.
A page load time of more than 3 seconds is bad.
b. Latency
Latency is also known as Response Time. This metric measures the time taken by the product’s system to respond to any request. To be clear, this is the time difference between the request and receiving the data requested.
Insights and importance
A good response time is essential for customer satisfaction as well it counts as good product performance. A response time of 0.1 seconds makes the users feel like the response was instantaneous. A response time should never be longer than 1 second.
It is essential for products to have their response time neither too fast (making it difficult to recognize) nor too slow (leading to user frustration).
4. Customer satisfaction metrics
The primary purpose of our product is to satisfy the needs of your customers. It will seem bad if it doesn’t stay true to this purpose. That said, customer satisfaction plays a major role in your product success.
Dissatisfied customers may lead to an increase in the churn rate.
Moreover, satisfaction metrics portray the power of word-of-mouth. A dissatisfied customer can spoil the overall reputation of your product among your possible customer base.
To keep yourself away from all these worries, measuring customer satisfaction metrics and acting on the gathered insights is essential. Let’s dive in to explore three important satisfaction metrics for our product.
a. Customer Satisfaction Score (CSAT)
This is a direct metric to measure your customer satisfaction with your product.
Instead of getting inside complex calculations, CSAT helps in measuring the satisfaction of your customers in a simple way — by asking them.
After any particular task in the product, or after the product usage in general, ask a question to your customer like
“How would you rate your overall satisfaction in using the feature/product?”
The answers can be responses related to numbers from 1-5, where 1- very unsatisfied and 5- very satisfied.
Formula
CSAT= (No. of satisfied customers/ Total number of responses) *100
Here, satisfied customers include the ones who responded with numbers 4 and 5.
Insights and importance
A good CSAT score is something above 70%. CSAT helps in the easy assessment of your product performance.
b. Customer Effort Score (CES)
It is the measure of how easy it is for your customers to interact with and perform certain tasks in your product.
This is also a metric where you directly ask your customers to rate the effort they had put in to complete an action.
You can ask your customer to rate the effort they put
- After the touchpoint that led to the purchasing of the product.
- After the onboarding process of your product.
- After contacting your customer service
- After performing certain actions inside your product.
Formula
Ask your customers questions like “How easy was it to purchase our product?” and provide them with options ranging from 1-5, where 5 being “very easy” to 1 being “very difficult”. Record their responses.
CES= %High-Level Effort — % Low-level effort
For high-level effort, take the number of responders who answered between 4-5, and for low-level effort, take the number of responders responding 1-2.
Insights and importance
Your CES must be generally low because the attention span of people has reduced. If they have to put in so much effort to perform a task, they would leave.
Similarly, if they find the process to purchase your product being tedious, they will probably not buy it. Making every single process easy for your customers should be your priority.
5. Retention metrics
Retaining customers is cheaper than acquiring new ones. Acquiring new customers requires cost and services. But for retaining the existing ones, all you need to focus on is the product.
Moreover, losing a customer is the loss of revenue as well as the cost for their acquiring. Many factors are linked to customer retention. Retention of customers is what makes your product business stable.
These metrics are a great way to indicate if the retention efforts you take are working out or not.
a. Churn Rate
The churn rate is the measure of customers you lose in a particular period. The loss may be due to either a cancellation, downgrade, non-renewal of the subscription.
To measure churn rate you have to decide the period, for example, 3 months. Note down the number of customers who are using your product at the beginning of this period.
Formula
Churn Rate= (No. of customers lost in a period/ No. of customers at beginning of the period)*100
As mentioned before, you must take into account not only the customers who canceled your subscription but also the ones who didn’t renew it.
For example, let’s take 3 months. You have 1000 customers at the beginning of the 3 months. In the three months, 100 people canceled your subscription, and 100 people haven’t renewed your subscription. So your churn rate will be,
100(cancellations)+100(Non-renewals) /1000 (Total no. of customers in the beginning)*100 which is 20%.
Insights and importance
A high churn rate is an indication that there is a major issue with the product or its feature. Churn rates increase because
- The users feel frustrated with the product performance.
- The main purpose or function of the product is not met.
- Users find issues with your product pricing.
Churn is unavoidable during the initial stages of your product’s growth. But what is the acceptable churn rate? For SaaS companies, a 5-7% annual churn rate is acceptable. Anything more than that is alarming.
To reduce the churn rate, you must
- Maintain good communication with your users and understand their satisfaction and dissatisfaction.
- Try to improve the features that lead to customer churn.
- Add new and useful features and provide continuous value to your users.
- Sometimes customers are not familiar or find difficulties with the usage of your product. Make sure your onboarding process provides clarity in overall product features.
b. Customer Retention Rate
Customer Retention Rate is the measure of customers that you have managed to retain for a period of time. These customers opt for your product again and again. They continue to renew the subscriptions.
Decide the period you want to measure the retention rate for. Take notes of customers that are present at the end of the period, new customers added during this period, and the total number of customers at the beginning of the period.
Formula
Customer Retention Rate= [(E — N)/S]*100
Where E- No. of customers at the end of the selected period
N-No. of newly added customers during this period
S- Total no. of customers in the beginning.
Insights and importance
Low customer retention shows that the effort you put in retaining a customer is not enough or the strategy needs improvement. A good customer retention rate is 35% or above that.
Retention rate is an indication of how satisfied are your customers with your product and service. To improve your customer retention rates,
- Deliver more than what you promised
- Maintain transparency in your services
- Encourage loyalty in customers by providing them a few benefits.
- Focus on providing personalized services.
c. Customer Lifetime Value (CLV)
It is a measure of the revenue you can expect from a single customer for your service during the period of your relationship with the customer. CLV can help in setting benchmark values for your Customer Acquisition Cost.
Reducing churn and focussing on retention strategies improves the customer lifetime value.
Formula
CLV= Customer Value * Average Customer Lifespan
Insights and importance
High CLV indicates that customers are loyal to your product. Focussing on improving CLV is important. This is because it is easier to sell a new product to an existing customer than to a new one.
CLV provides you with valuable insights like what category of customers provides more value. With this information, you can focus on the right user personas.
It helps in measuring the loyalty your users have towards you and indicating if you need to improve on it.
6. Revenue metrics
A product can be called successful when the users love it enough to pay for it. Tracking your revenue is vital for knowing profitability. Also, revenue is one of the indications that tell whether your product is doing well or not.
Revenue metrics are the indications of your product’s financial performance. To measure and make the most of the revenue data, we bring you two important revenue metrics for our product.
a. Monthly Recurring Revenue (MRR)
Monthly Recurring Revenue is the metric to measure the recurring revenue that your product is earning for 30 days.
Recurring revenue is the income that is expected regularly. This is used by products that offer monthly subscriptions to users.
Formula
MRR= ARPU* Total no. of customers in that month
For example, if your Average Revenue Per User is $100 and the total number of users is 150, then MRR is determined by $100*150, which is equal to $15,000.
Insights and importance
MRR only gives the figure of your monthly income. But there are classifications of MRR that give nuances and details about additions, loss, and growth, in turn, the revenue. This helps in identifying areas that need improvement. They include,
New MRR- Revenue added due to new customers
Expansion MRR- Revenue added by upgradations
Churn MRR- Revenue lost due to subscription cancellation or degradation of plan
With all these values you can calculate MRR growth, using Net New MRR which is calculated by the following formula
Net New MRR= New MRR + Expansion MRR- Churn MRR
MRR is the indication of the health of your business. Analysing MRR will help you in finding if your revenue is growing or reducing.
b. Average Revenue Per User (ARPU)
This metric measures the revenue you can expect to acquire from a single customer. This is generated by taking the average of total revenue from the customers.
To measure ARPU, you need to decide on a time frame. This metric is very important for subscription-based products.
Formula
ARPU= Total revenue of the company in a particular period/ Total no. of customers
Insights and importance
ARPU metric helps in indicating the revenue generation capability of your product. Usually, this metric is used for comparison with your market competitors. It is also used in the calculation of important metrics like ARR
7. Referral metrics
Referrals are of great advantage to any product. They are the indications that your product has performed well to gain loyal customers.
People believe their friends and associates more and are ready to adopt the product suggested by them.
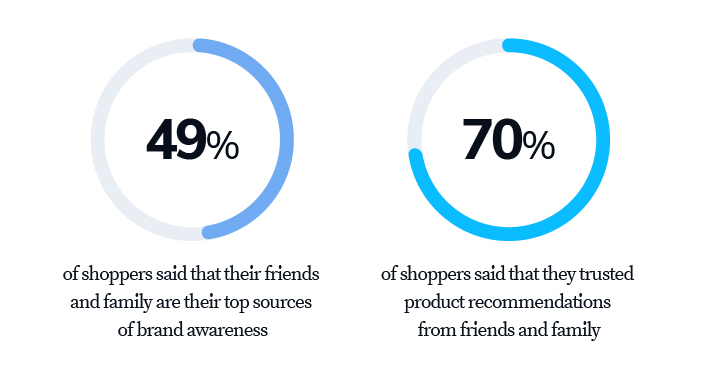
But it doesn’t stop there. Referrals play a huge part in customer acquisition. But the best part is, the acquisition cost is cut off here. Hence understanding and measuring the referrals that bring in a huge advantage is important.
Here are two referral metrics, that help you understand your referral techniques as well as assess your products.
a. Viral Coefficient
This metric gives the measure of new customers generated by your existing customers. This metric does not calculate the number of referrals your existing customers make, but the referrals that are successful in converting the customers.
Virality occurs when the product users promote the product, usually through word of mouth. Customers usually convey about the good features of your products after they use them.
Formula
Viral Coefficient= C*R*CR/100
where
C- No. of customers
R- No. of referrals
CR- Average Conversion Rate
Insights and importance
The Viral Coefficient is important because it indicates the growth of your product business. The virality of products may lead to the exponential growth of customers. Virality is also a result of your product’s great performance.
Usually, the Viral Coefficient value above 1 will bring new customers to your product. This greatly helps as an acquisition technique for your product. The Viral Coefficient can be positive only if the time difference between referrals and the resulting conversion is short.
Also being prepared for virality is an important part to make this strategy a success. You must make sure that sudden explosive usage shouldn’t affect product performance.
b. Net Promoter Score (NPS)
Net Promoter Score is the measure of your customers who are likely to promote or recommend your product.
A completely satisfied and happy customer will be more than ready to recommend your product to others. Also, when it comes to recommendations, people are very particular and cautious. They only recommend it to others when they find the product and its features completely useful.
To find out NPS, you can directly ask the customers whether or not they will commend it to their friends. Questions like “ On a scale of 1-10, how likely are you to recommend this product to a friend or colleague?”
Formula
NPS= %Promoters — %Detractors
Promoters are those people who answered in the range of 9-10 for the above question, while detractors are those who answered below 6.
The possible values for NPS are taken from -100 to +100. A negative score indicates that the majority of your users are not ready to recommend our product. Any positive score is good because promoters exceed the detractors. Top performing companies usually have their score above 50.
Insights and importance
NPS is important because along with understanding the product performance, you can identify the number of loyal users you have.
Along with the recommendation score, you can add questions as to why the user would recommend or not recommend the product.
And through these answers, you will be able to understand the areas your product is lagging. Sometimes these answers can also help in finding the grievances of the user.
North Star Metric and its importance
In addition to all the above-mentioned metrics, there is one crucial metric every company must measure and track — the North Star Metric.
It aims at calculating one metric that truly portrays the value your product provides and the resulting long-term growth. North Star Metric is unique for each company and determined based on what their product purpose and business focus are on.
To find out what would be the North Star Metric for your product, you must find out your product vision. You must analyze what value your product is aimed to provide your customers. After identifying these, you get to find that one action/function of your product that can measure the value provided.
For example, let us consider Spotify. The core value Spotify aims at providing its users is offering high-quality music. Spotify aims at bringing albums or songs from new artists and music lovers on a single platform. Hence it’s North Star metric is ‘time spent listening to music’.

North Star Metric is important as it keeps your product vision in check. This helps every individual team to contribute to a common objective. Measuring this metric and regularly monitoring it makes you aware of the long-term growth of your product. Moreover, it is concerned with customer satisfaction, which is ultimate.
How to make the most of your metric data?
Being aware of metrics and measuring them only to abandon the data results later is a waste of time and energy.
What matters the most is getting sorted with the data by analyzing them. You can identify the results of your product business here. With analysis, you understand what areas are excelling and which ones need improvement.
The most important part about metrics handling is the action you take after the analytics. Metrics help you know the direction you need to take. It is the measures you take after that help you proceed in that direction.
The measures may include changing your strategies or improving your product performance. For this, you must have the right plan in hand.
Endnote
A product in the market has various phases of a relationship with its customers like acquisition, retention, and referrals. Hence, having your metrics associated with these is a huge advantage for you.
This helps you monitor the stages your customers are in and also lets you know your product positioning in the market.
As time goes by, your business and the users evolve and this is why you need to keep revising your metrics from time to time.
Measuring performance and analysis of metrics is not a one time process. It is continuous. It goes on until your product is in business. Are you ready for the marathon of measuring and resulting management?


Add comment